
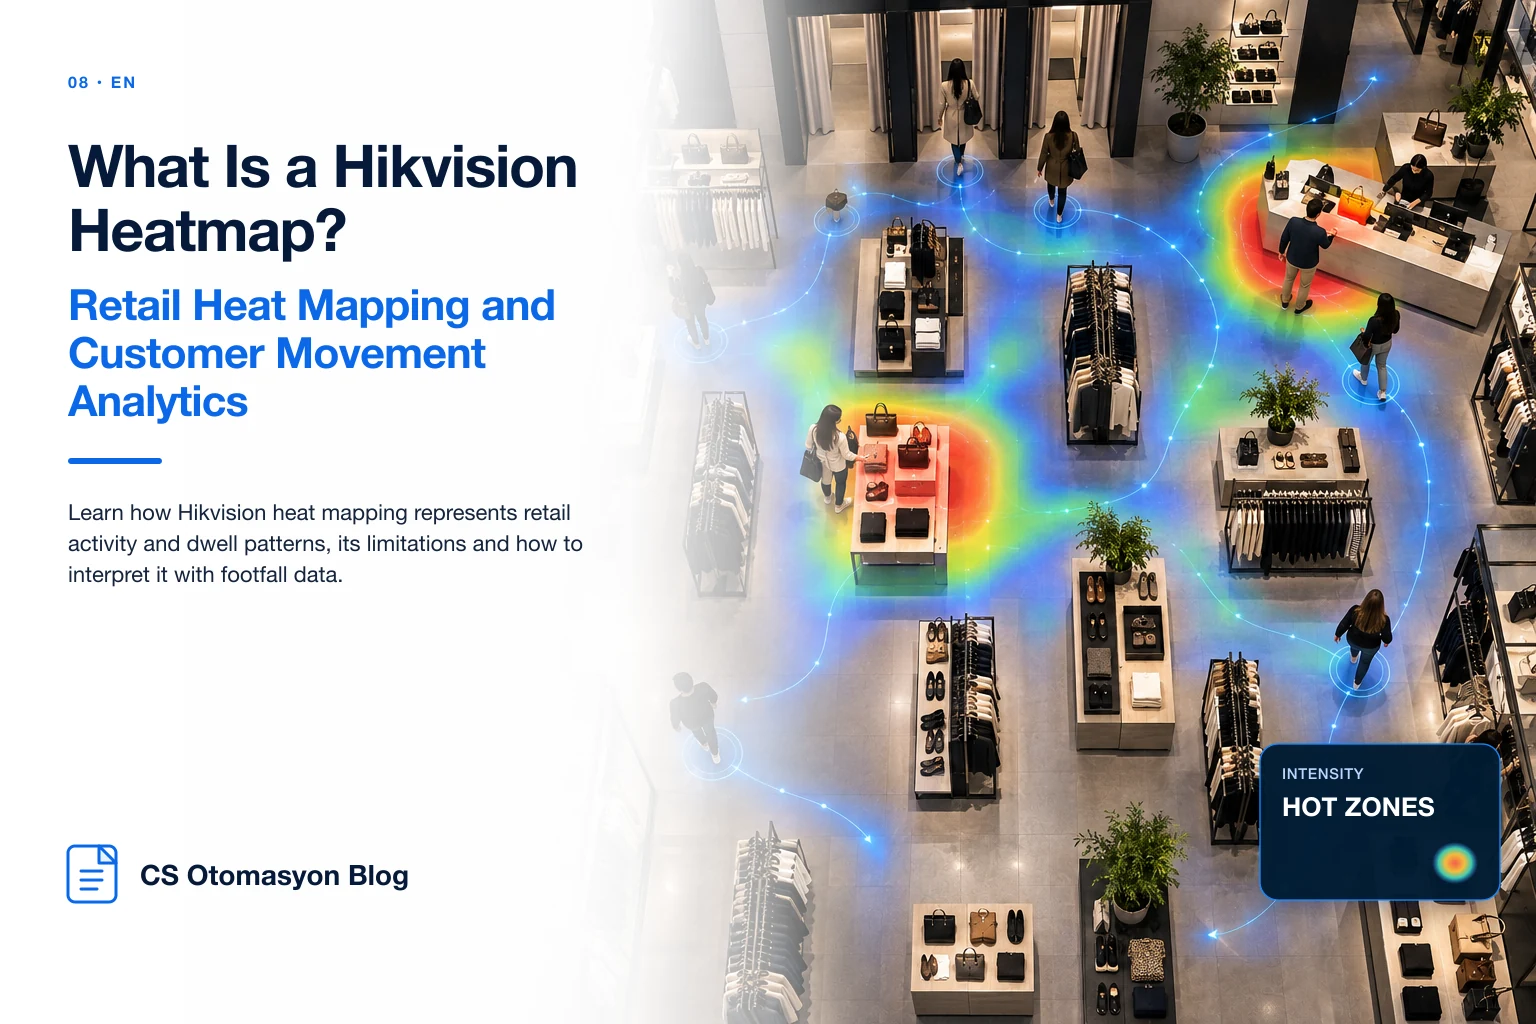
What Is a Hikvision Heatmap? Retail Heat Mapping and Customer Movement Analytics
Overview and context
In Hikvision retail analytics, heatmaps visualize areas visited more frequently or for longer periods using color intensity.
Technology and analytics capabilities
People counting answers how many entered, while heat mapping answers where visitors concentrated inside the store.
Limitations and field criteria
High dwell does not always mean high interest; checkout waiting can create long dwell that reflects friction.
Procurement / integration decision
When the store layout changes, heatmap zones should be revalidated because shelves and fixtures can alter the scene.
Separating frequent visits from long dwell
A dark heatmap area does not explain why it is hot. It may reflect many short visits or fewer long stays. Hikvision’s retail materials discuss both visitor activity and dwell, which is an important distinction for interpretation.
A promotion area with high visits but low dwell may attract attention without deeper engagement; low visits with high dwell may indicate a niche area used intensely by a smaller group.
Designing a heatmap experiment
After changing a shelf layout, comparing colors alone is weak evidence. Before/after periods should be compared under similar traffic conditions, while campaign timing, weekends, seasonality and overall footfall are considered.
A practical report can record the test zone, a control zone and the change date so the heatmap becomes a simple experiment tool rather than a decorative visualization.
Why checkout, entrance and service zones need different interpretation
High dwell at checkout often means waiting, not merchandising interest. Entrance congestion can come from gates or greeting behaviour, while long dwell at a service desk can signal advisory demand.
Zones should therefore be labelled by business function. The same heat intensity means different things in a sales area, checkout or service point.
Which KPIs should sit beside heatmap data?
Zone traffic, zone dwell, total store footfall, category sales and stock availability can create a more useful story. High zone traffic with weak sales may lead teams to investigate price, stock or merchandising.
The objective is not to display an attractive heat image; it is to make layout decisions measurable.
The CS Otomasyon approach
For heatmap projects, CS Otomasyon goes beyond producing a colourful image. Zone definitions, test periods, traffic normalization and layout changes are documented so the heatmap becomes an experiment tool for merchandising and layout decisions.
FAQ
Can a heatmap explain sales on its own?
No. It should be interpreted with sales, campaign and stock data.
Why can checkout areas be misleading?
Waiting time can create high dwell without indicating product interest.
Can heatmap colours be compared directly across stores?
Not safely unless the same normalization and reporting period are used.
Does a layout change require revalidation?
Yes when the camera view or configured analytics zones are affected.
Does heatmap prove sales causality?
No. Sales, stock, campaign and traffic data are needed to test a business hypothesis.
Conclusion
Choose the technology against the real entrance geometry and target KPI rather than the logo on the device. A site survey and controlled pilot with CS Otomasyon can validate the architecture before rollout and connect the resulting data to centralized reporting.