
How Does Hikvision Queue Management Work? A Camera-Based Queue Analysis Guide
Overview and context
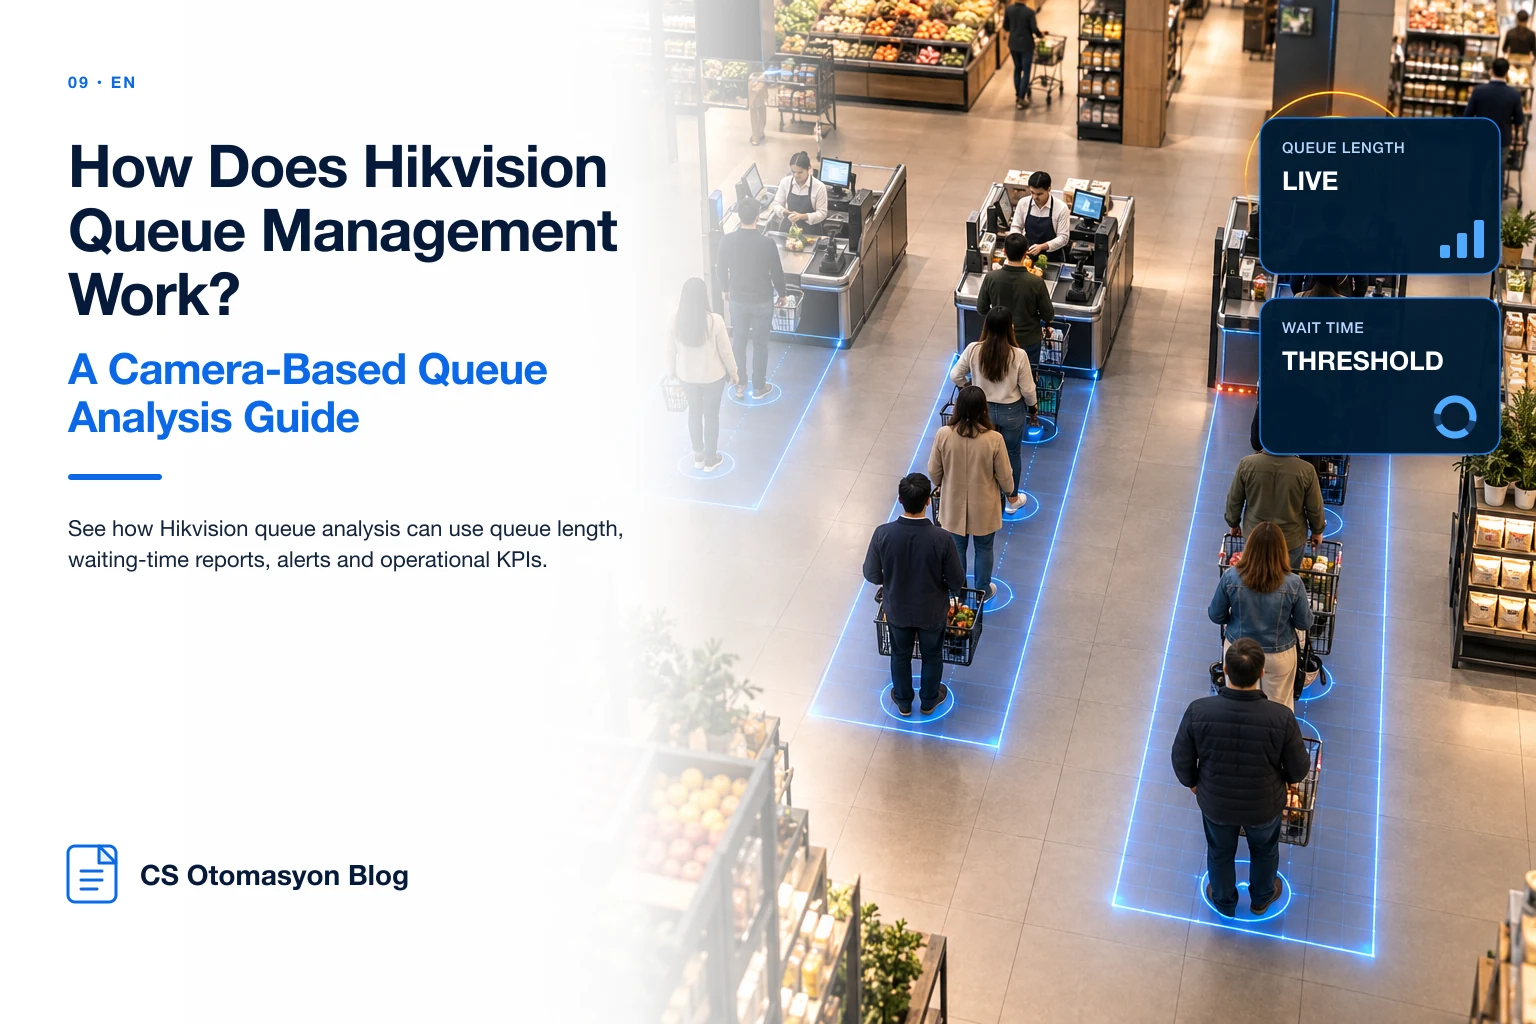
Hikvision queue reports expose concepts such as queue exceptions, people in queue, waiting duration and queue length.
Technology and analytics capabilities
Real-time alerts can trigger staffing actions, while periodic reports reveal recurring capacity problems.
Limitations and field criteria
Useful KPIs include average wait, threshold breaches, maximum queue length, peak periods and recovery time after intervention.
Procurement / integration decision
The waiting zone must be separated from pass-through traffic to avoid false queue detections.
Separating real-time and historical queue value
Queue analytics supports two decision loops. In real time it can trigger another checkout or staff reallocation; historically it shows which days and hours repeatedly suffer capacity pressure.
If alerts are too sensitive, staff develop alarm fatigue. If thresholds are too loose, the notification arrives after the experience has already deteriorated. Thresholds should be tuned during a pilot.
Why queue length alone is not enough
Five people may be acceptable at a fast checkout, while two customers at a complex service desk can create a long delay. People in queue, waiting duration and service speed should be interpreted together.
Physical queue design also matters. A serpentine line, separate checkout lines and an informal waiting area require different zone logic.
Normalizing queue KPIs by traffic
Comparing a busy Saturday with a quiet Tuesday using maximum queue length alone is misleading. Metrics such as queue events per 100 visitors, wait by traffic band or peak-queue duration can provide more context.
The same principle helps cross-store benchmarking: a high-volume store naturally has more absolute queue events, so the meaningful question is whether service capacity keeps pace with traffic.
Building a closed operational loop
A mature queue project measures alert, staff response and recovery rather than stopping at notification. That shows whether intervention actually reduced waiting.
When queue data is joined with footfall, staffing and POS, teams can estimate which staffing level is adequate for a given traffic load.
The CS Otomasyon approach
CS Otomasyon separates real-time queue alerts from historical capacity analytics. Thresholds are piloted by store format and joined with footfall and staffing so the project supports intervention and planning rather than merely visualizing queues.
FAQ
What queue threshold should be used?
There is no universal threshold; calibrate it to service time and customer-experience goals.
Should queue data be combined with footfall?
Yes. Normalizing against traffic volume makes the metric more meaningful.
Can queue thresholds vary by store?
Yes. Store format, service time and physical space can justify different thresholds.
How is waiting duration measured?
Analytics typically tracks trajectories or presence within a configured queue zone; the exact method depends on the product.
Can queue alerts be joined with POS data?
Yes. Time-aligned traffic, transaction volume and service capacity can be analyzed together.
Conclusion
Choose the technology against the real entrance geometry and target KPI rather than the logo on the device. A site survey and controlled pilot with CS Otomasyon can validate the architecture before rollout and connect the resulting data to centralized reporting.