
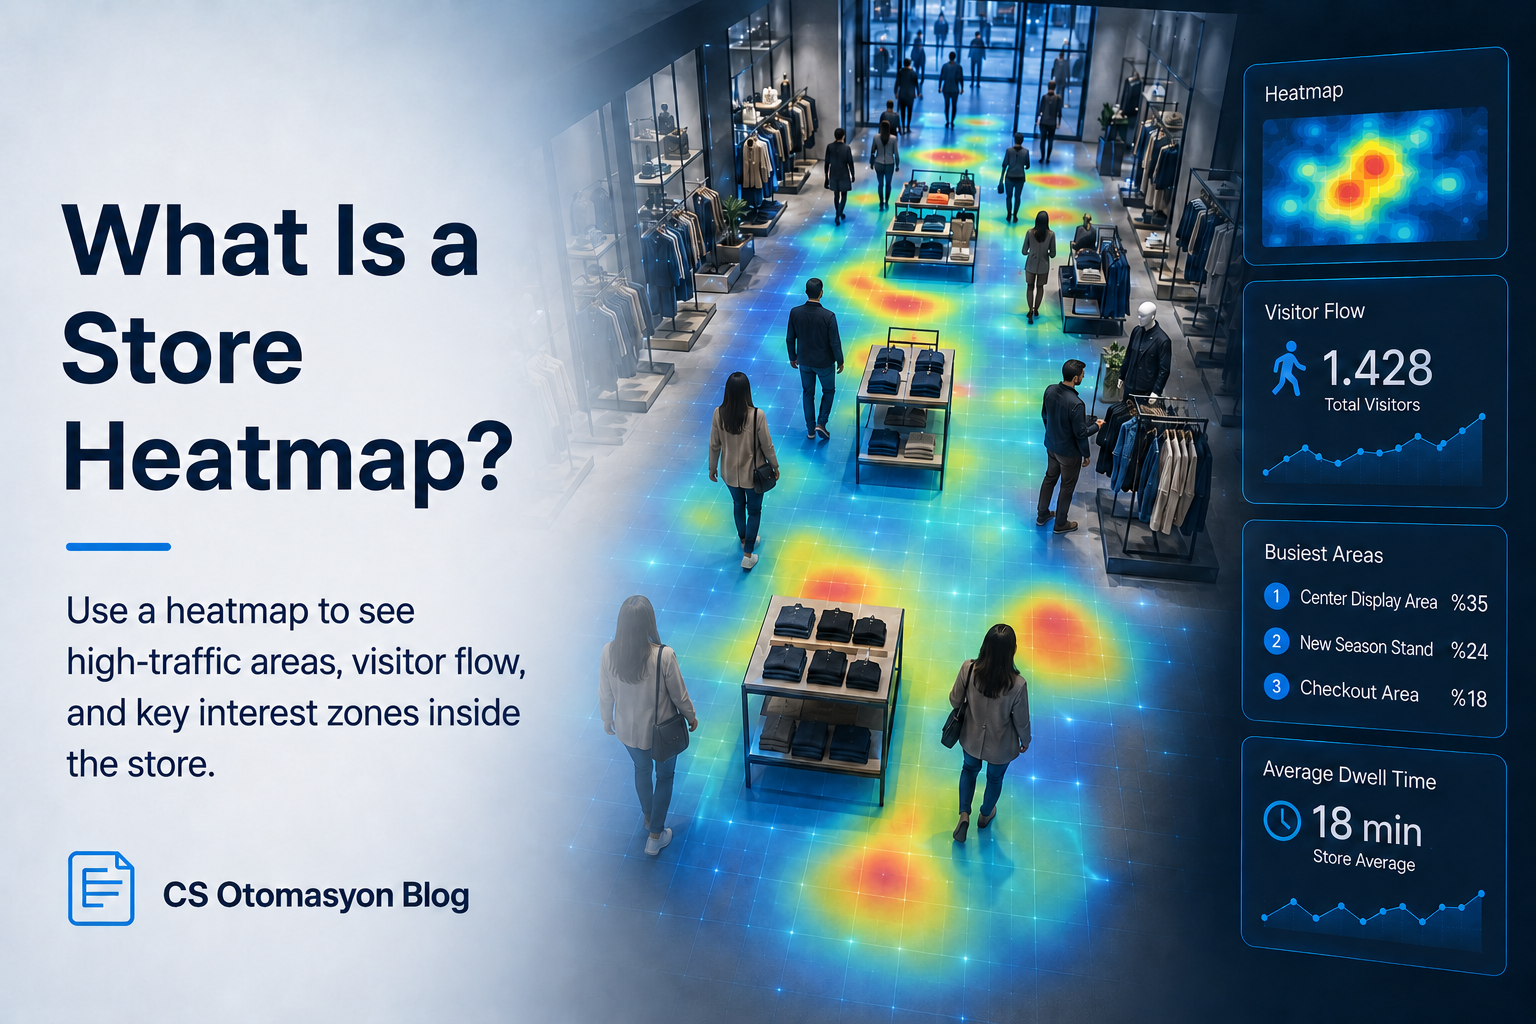
What is a Retail Store Heatmap? Spatial Analytics
What is a Retail Store Heatmap? Spatial Analysis Approaches
Once customers enter your store, what route do they follow? Which aisles attract more attention, and which areas remain relatively quiet? When seeking answers to these questions in physical retail, systems that visualize spatial data are referred to as "Store Heatmaps."
The Logic Behind Heatmaps
Similar to tools that show user behavior on digital platforms, heatmaps in physical retail represent movement through a color scale. The collected spatial data is projected onto a store layout, typically using colors ranging from red to blue. Warm colors represent areas with high activity, while cool colors indicate zones with relatively low traffic.
Why is In-Store Customer Movement Important?
While door traffic data shows overall potential, in-store directional data helps you understand how that traffic distributes inside. Visitor routes offer clues about how well the store planogram and product placements meet visitor expectations.
Which Areas Are Visited Most?
Window and Corridor Analysis: The fluidity of main corridors from the store entrance and eye-catching window displays can be evaluated using spatial analytics. Product Placement and Checkout Zones: The strategic positioning of high-interest product groups near complementary items can be tested via these maps. Checkout areas, which carry potential for impulse purchases, are also critical zones to monitor for activity.
Relationship with Sensor and Analytics Systems
These analyses can be configured with specialized analytical systems that monitor the space from above and convert movement into a density matrix. For advanced projects, an anonymous data approach can be prioritized to align with privacy regulations (like GDPR/KVKK), turning spatial data into meaningful reports.
Advance with Spatial Insights
To understand customer trends in your store and build spatial optimization strategies, you can evaluate CS Otomasyon’s video analytics platforms and people counting solutions.
Frequently Asked Questions
Are security cameras used to create heatmaps?
Using purpose-built analytical cameras or top-down sensors can often improve data quality compared to standard security setups.
How are "dead zones" evaluated?
These are areas that remain cold (blue) on the map; they can be revitalized by rotating products or improving lighting.
How should privacy compliance be managed?
Instead of identifying individuals via video recording, systems that collect anonymized density data can be deployed.
Is the data real-time?
It is mostly preferred to review trends as reports generated at the end of the day or in periodic hourly segments.
Can store layouts be tested?
Yes, by reviewing the heatmap again after a certain period following a layout change, A/B testing can be conducted.
Explore CS Otomasyon people counting solutions or read more articles.