
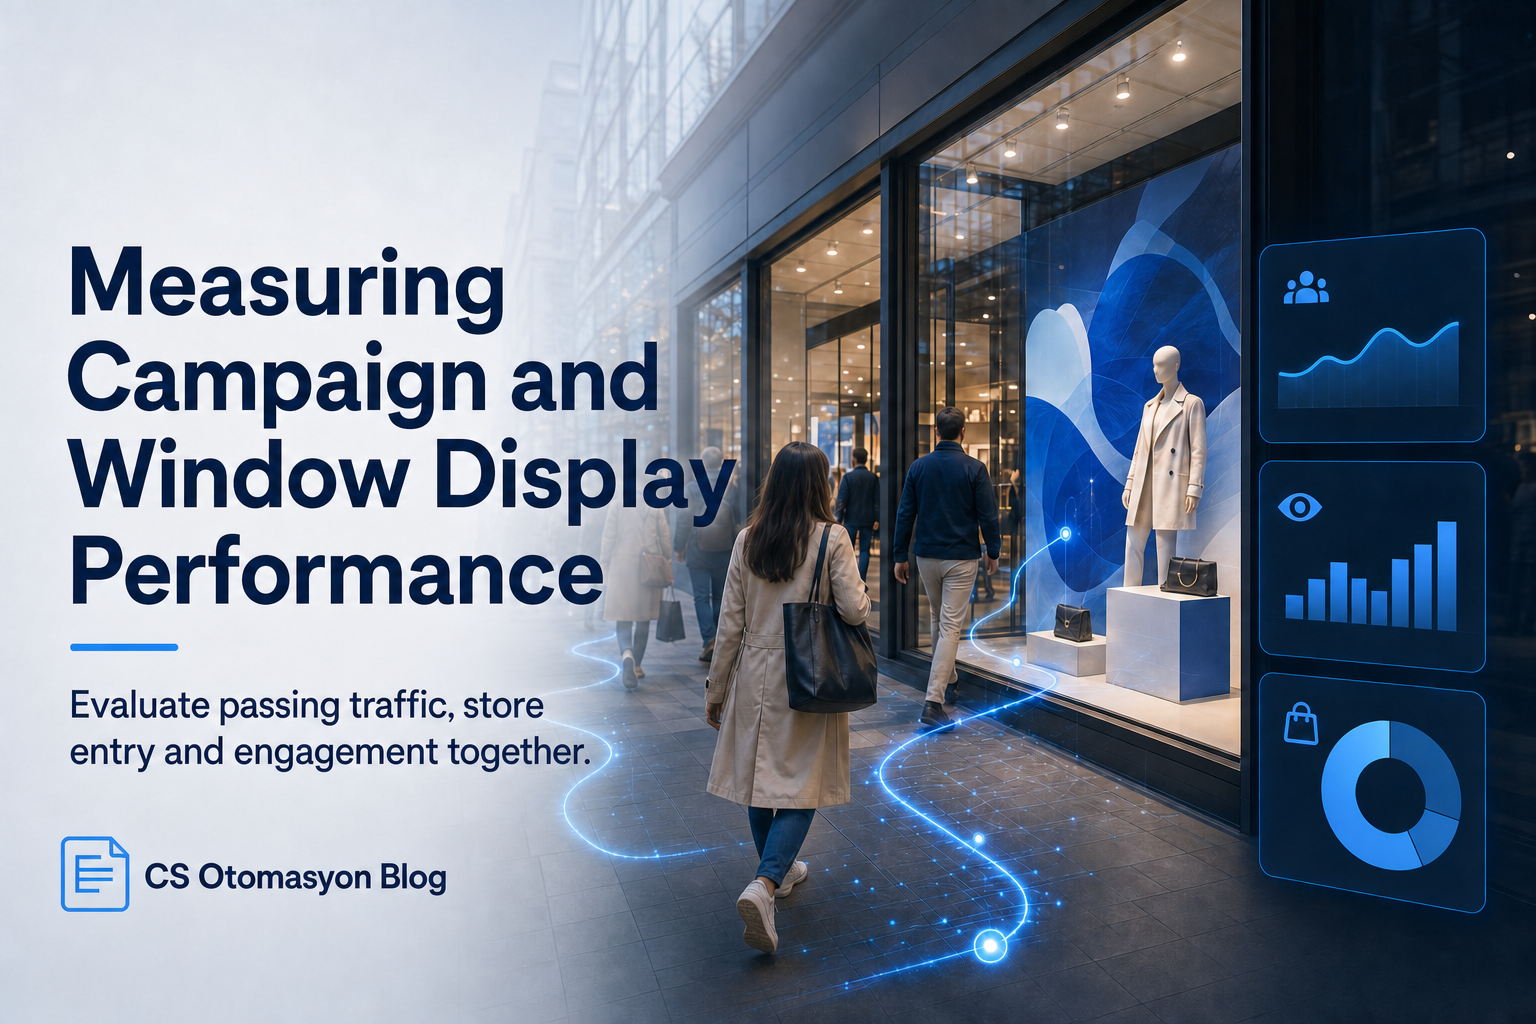
How Is Campaign and Window Display Performance Measured with Visitor Data?
Finding the Physical-World Return of Marketing Budgets
On e-commerce platforms, countless metrics such as Click-Through Rate (CTR) and Bounce Rate are used to measure the success of a digital advertising campaign. But in physical retail, measuring how many people expensive window designs, street posters or in-store music/scent campaigns bring through the door has traditionally been a black box for businesses. Advanced people counting and traffic analytics systems turn marketing and window display strategies in physical spaces into measurable A/B tests, just as in the digital world. The goal is to base aesthetic decisions entirely on numerical data.
How It Works: Outside Traffic and Capture Rate
At the heart of campaign and window display analysis is the Capture Rate. To calculate this rate, it is necessary to count not only people entering through the store door, but also the pedestrian traffic passing outside the store and within the storefront's field of view. The system works as follows:
- Street / Passage Traffic (Pass-by Traffic): The total crowd passing in front of the store. Special outdoor-area sensors facing the outside environment or shopping mall corridor are used for this.
- Entry Traffic: The number of people who pass through the door and step inside.
- Capture Rate: (Entry Traffic / Outside Traffic) x 100.
- Window Dwell Time: The average time customers stop in front of the window and examine it.
If a change in the window display or a new visual causes a positive or negative change in capture rate, the campaign is directly measured.
Critical KPIs That Can Be Measured
Main performance indicators that marketing teams can use in physical stores include:
- Pre/Post Campaign Capture Rate: The change in the new window display's ability to bring the outside audience inside.
- Campaign Conversion Rate: Verifying with POS data whether the extra crowd brought inside by the window display actually made purchases. See our related integrations.
- Physical Equivalent of Customer Acquisition Cost (CAC): Window/campaign cost divided by the number of additional visitors entering.
Real Use Case: A/B Test with a Control Store
A clothing brand wants to test an expensive new season window concept before applying it to all branches across Turkey. An A/B Test (Control Store) approach is adopted. The brand selects two stores that are very similar in pedestrian traffic and demographics. Store A receives the new technological and animated window display, while Store B (Control Group) keeps the old standard window. Outside traffic and entry data are collected for two weeks. It is found that Store A's entry (capture) rate increased from 12% to 18% while outside traffic remained unchanged, whereas Store B's rate stayed at 12%. This data scientifically proves that the new window design is successful enough to justify the investment cost.
Limitations and Points to Consider
When analyzing windows and campaigns, external factors that can contaminate data must be considered. Street closures, sudden changes in weather, public holidays or aggressive discounts by competitor stores can affect pedestrian traffic in front of the store. Outdoor traffic sensors should be professionally positioned so they are not affected by glare from sunlight or tree branches. Isolated time periods should be compared during analysis.
CS Otomasyon Approach
CS Otomasyon provides end-to-end video intelligence platforms in retail analytics. Going beyond standard systems that only count entrants, we report pedestrian flow on your storefront through heatmaps and density graphs. By marking your campaign dates in the system, we create setups that help compare before and after periods on the same reporting screen.
Confounding Factors in Measurement Design
When evaluating window or campaign performance, other elements that change during the same period should be recorded. Product price, stock availability, weather, roadworks nearby, shopping mall events and store operating hours can affect pass-by and entry rates. If these variables are not noted, the result may be attributed directly to the window design and lead to a wrong creative decision.
The success criterion should be clarified at the start of measurement. In some campaigns, the goal is to increase dwell time in front of the store; in others, to raise entry rate; in others, to improve sales conversion for a specific product group. Each goal requires a different dataset and evaluation period.
- Pass-by traffic: Total movement passing in front of the store.
- Capture rate: How much of the pass-by traffic enters the store.
- Dwell time: Time spent in the defined window area.
- Conversion: Evaluating visitor traffic together with transaction or receipt data.
- Comparison: Comparing similar days, hours and locations using the same method.
Instead of giving a single good or bad score after analysis, it should be explained which stage of the customer journey changed. If pass-by traffic increased but entry rate fell, the window message may be examined; if entry increased but sales stayed the same, stock, price or in-store experience may need review.
Comparison Period and Data Sufficiency
There is no fixed sample duration valid for every campaign. A few hours of data can be misleading in a low-traffic store, while weekday and weekend behavior may differ in a high-traffic location. Measurement duration should be determined by expected effect size, traffic volume and similarity between compared periods.
- Pre-definition: Writing the target KPI and evaluation rule before the campaign starts.
- Data integrity: Marking sensor interruptions, closed hours and unusual days.
- Similar period: Comparing the same day type and, if possible, similar time intervals.
- Sufficient observation: Checking that the result is not based on a single traffic spike.
A change being commercially meaningful does not necessarily mean it is statistically reliable. Before high-budget decisions, the appropriate method should be selected by an analytics specialist, and results should be reported with observed relationship, uncertainty and possible alternative explanations rather than a claim of definitive causality.
In campaigns run across multiple branches, stores should be normalized by size, location, historical traffic and operating hours before being ranked directly. If a control store can be used, a similar location where the campaign is not applied should be selected, and whether the initial trends of the two stores are truly similar should be checked. This prevents general market movement from being mistaken for campaign effect. The result report should clearly state the date range, excluded days, data gaps and calculation method used. If the same rules are preserved in later campaigns, more reliable comparisons can be made across periods.
FAQ
Can window display performance be measured with devices that only count inside traffic?
No. To know whether an increase in entering customers comes from the window display or from the street being generally busier that day, outside pass-by traffic must also be measured.
Are people standing in front of the window identified?
In the window and pass-by traffic scenario discussed here, the purpose is not face recognition or identifying people by identity. The project can be designed to produce anonymous passage and movement data. The camera, software and data retention method used should also be evaluated in terms of KVKK and privacy.
How long should physical A/B tests last?
It is recommended that campaigns be tested for at least 2 to 4 weeks so external factors can be filtered and a statistically meaningful dataset can be formed.
How is Dwell Time measured?
A virtual zone is drawn in front of the window area using cameras and AI algorithms. Targets that remain stationary in this zone for more than a defined number of seconds are measured.
Conclusion
Entrusting your physical-space marketing activities to measurable numbers rather than intuition helps you stay one step ahead in competition. For window optimization and advanced retail analytics, you can speak with CS Otomasyon engineers.